Promising Practices: Transit Technology Adoption Promising Practices Profiles
- Date: February 11, 2022
Jump to section
CARTA’s WayFinder SMART Travel System
Promising practice: A customizable app with visual cues and recorded audio directions to help individuals with intellectual disabilities travel.
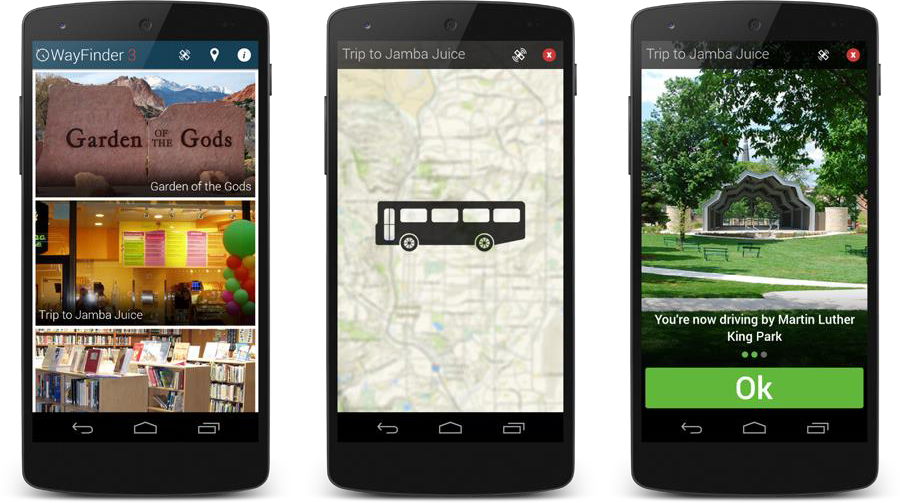
Riders participating in this pilot project use a tablet equipped with vendor AbleLink’s WayFinder to navigate fixed-route service. WayFinder is a customized navigation system that can be programmed with individual routes. Riders are guided from their origin to their destination with visual cues and recorded audio directions. The Tennessee Department of Intellectual and Developmental Disabilities (DIDD) funds the project through its Enabling Technology program, which helps individuals with disabilities to be as independent as possible with the use of new technologies.
Context
AbleLink worked with DIDD to identify potential test sites for their WayFinder technology in Tennessee and settled on Chattanooga’s Orange Grove Center, which is in CARTA’s service area. Some individuals with developmental and cognitive disabilities that are enrolled in adult programs at the Orange Grove Center have jobs throughout the Chattanooga area. Although many of these individuals rely on CARTA’s paratransit or their families for transportation to and from their job sites, WayFinder and CARTA can help individuals travel independently. Independent travel has multiple benefits: independence for the individual; decreased responsibility on behalf of family members to meet transportation needs; and shifting the agency’s riders from paratransit services to more cost-effective fixed-route service, which could decrease operating costs.
The Orange Grove Center has worked with individuals with intellectual or developmental disabilities since 1953 . TN DIDD worked with the Center and its clients to test WayFinder.
Alana Shores is CARTA’s travel trainer, and her main responsibility is to teach people how to use public transportation. In this pilot project, she is responsible for setting up rider routes in WayFinder and training riders to use the application. To perform the setup, Ms. Shores needed to ride the bus just like a WayFinder user would; create GPS waypoints along the route; take pictures to make visual cues; record verbal cues that were synced with visual cues and GPS location data, and conduct quality control of the routes. Because each rider has a different worksite, each route setup in WayFinder is unique, with different origins, destinations, and itineraries. It took approximately four months from initiation for CARTA staff to receive WayFinder training, set up the routes, secure tablets from the Orange Grove Center that could run the app, and begin their initial training with a rider from the Orange Grove Center. The agency plans to work with more riders once it is safe to do so as expansion plans were put on hold during the COVID-19 pandemic.
Before riders could be selected for the program, robust approval, testing, and safety procedures were established. The Orange Grove Center worked with individuals and their families to explain the goals of the program, receive their consent, and gather feedback from the individuals’ Direct Support Professionals at the Orange Grove Center. Potential riders needed to pass an assessment that tested their ability to identify road signs and choose the safest walking routes from a series of pictures before they could participate in the program.
Resources
Because DIDD funds the pilot, CARTA did not need to provide any direct funding. However, the agency contributes significant staff time and human resources. Ms. Shores spent two months learning the software and developing the first route, and CARTA staff will be responsible for route setup and rider training and for each new route and rider in the future.
Long-term, widespread WayFinder use could move riders from paratransit to fixed-route service, which would decrease operating costs. At an agency level, CARTA has a dedicated travel training program that was established in 2002 and has helped hundreds of riders navigate the fixed-route bus system independently, providing riders with additional mobility options. The training process for riders in the pilot project is more involved than the general travel training that CARTA conducts. These riders may be new to transit, or elderly, or have a development or physical disabilities that may otherwise necessitate their use of paratransit. According to TCRP Report 168, Travel Training for Older Adults, reducing paratransit trips or shifting riders from paratransit to fixed-route service can result in substantial cost savings for transit agencies.
Riders participating in the program are given a tablet with all the route information that CARTA has programmed. The first tablets CARTA received from DDID for riders were unable to run the navigation app smoothly due to poor GPS functionality on the older tablets, and it took time to receive new tablets that could run the app without a problem. WayFinder is also available to the general public to use on tablets and smartphones, in which instance users would need to download the app and create their customized routes on their own.
Lessons Learned
Aside from the need to learn and use new technology, CARTA faced some obstacles in implementing WayFinder. Developing the routes was challenging from a technical perspective. For example, the audio and visual cues that riders receive through the app must match their bus’s location, but sometimes GPS connectivity was poor when the routes were being created in the system, and it caused the bus’s actual location to be out of sync with what the recorded GPS data reflected. In the long-term, there is some uncertainty about how to grow the use of the app and what future licensing or service options may look like. The AbleLink WayFinder application is currently priced at $349.99 for individual users in locations where the full WayFinder ecosystem services are not offered through a local transit agency. However, AbleLink also offers the WayFinder services to transit agencies, which allows the WayFinder app itself to be made available to its customers at no cost to the traveler.
Rider safety is a major component of the pilot project. By the time their training is complete, riders will not only use transit independently, but they will also navigate the last steps from transit to their destination safely on their own. Each commute is unique. Whereas one rider works at a school with an on-site crossing guard, another rider needs to walk three blocks on their own from the bus stop to their worksite. In these last few blocks, the rider needs to push signal buttons, wait for signals, and cross intersections of varying complexity. The program needed to consider these factors and the complexity of each route to ensure the safety of each rider through proper training. In the long-term, the program’s training component will have multiple phases which have not yet been rolled out due to COVID, and will include:
- An initial phase when CARTA sets up the route and trains the rider directly.
- Then, the Orange Grove Center provides additional training to the rider, focusing on the route to the bus and from the bus to the final destination.
- Finally, CARTA’s travel trainer and/or Orange Grove Center staff will follow the rider on their route without their knowledge to observe how well they follow the procedures they learned during their training and the extent to which they are able to complete the trip independently and safely.
Results
The pilot project is still in the early phase, but there are some initial takeaways. The project has moved forward thanks to solid stakeholder relationships, which have proved essential. Although the end goal is to have individuals traveling independently and safely, it has also made the organizations involved think critically about how much individuals with cognitive and developmental disabilities can achieve if they have the training and, more importantly, an opportunity to show what they can do. Ms. Shores stressed that any agency that works with people with disabilities should consider developing a similar program, especially if they serve individuals who live near fixed-route service. Since the pilot was launched, one agency has contacted CARTA to request a tour to learn more, and several other transit agencies have reached out to the agency for more information.
For More Information
Expert’s contact details: Alana Shores, Travel Trainer, CARTA, alanashores@gocarta.org
Video with Kenny, CARTA’s first rider under this project:
AbleLink WayFinder: https://www.ablelinktech.com/index.php?id=33 Orange Grove Center: https://www.orangegrovecenter.org/
TN DIDD’s Enabling Technology Program: https://www.tn.gov/didd/for-consumers/enabling- technology.html
Chattanooga Times Free Press article on CARTA’s travel training: https://www.timesfreepress.com/news/news/story/2012/jun/08/with-help-disabled-have-freedom-to- travel/79840/
TCRP Report 168, Travel Training for Older Adults: http://www.trb.org/Main/Blurbs/171323.aspx
Improving the Paratransit On-Demand Booking Experience, with an Emphasis on the Visually-and Hearing-Impaired
Promising Practice: Web-based booking and trip management platform to create a “one-click” experience for users of the three public transportation systems that incorporates technology to make it easy for the visually- and hearing- impaired people to access services.
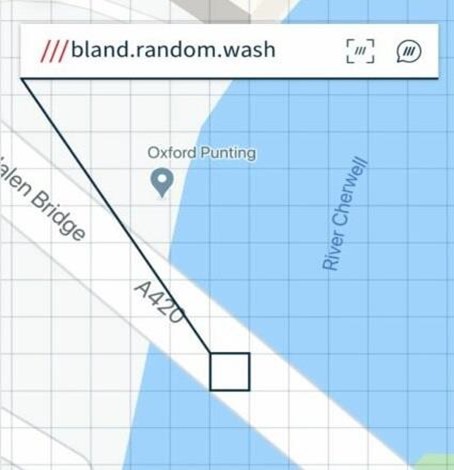
Southeast Michigan is a vast region – home to 4.2 million residents, spanning 2,600 square miles, and home to three major transit systems – including TheRide, DDOT, and SMART. In addition, SMART and DDOT have riders who utilize both paratransit systems each day, increasing the critical need for coordination in supporting riders. The RTA received a $1.05 million Michigan Mobility Challenge grant from Michigan Department of Transportation/PlanetM to create an integrated online booking and trip management platform to create a “one-click” experience for users of the three systems that could also be scaled to accommodate future growth. As part of this new “Michigan Ride Paratransit” app, Feonix – Mobility Rising (hereafter refered to as Feonix) will integrate What3Words technology into the app, which was employed under a previous project with TheRide. What3Words is an addressing convention that divides the earth into squares of three by three meters and assigns each square a unique, three-word code, assuring that riders and drivers will easily be able to find pickup and drop-off locations. Paratransit passengers who live in areas that Google Maps does not provide an exact address, such as an apartment complex, can enter their three-word address in the app.
Context
The idea for the Michigan Mobility Challenge project began in 2018 when representatives from the Michigan Division on Deaf, DeafBlind and Hard of Hearing; Area Agency on Aging; Veterans Administration; and transit agencies; social workers; and other advocacy leaders gathered at a governor’s summit to discuss the challenges their populations face. Individuals with disabilities, veterans, and other target audiences led sessions to share their experiences. The resulting Michigan Mobility Challenge aims to “address core mobility gaps for seniors, persons with disabilities, and veterans across the state and encourages public-private partnerships. In response, Feonix proposed the development of the Michigan Ride Paratransit app to address problems these populations experienced with transit – two of the most significant being arduous trip booking experiences and location confusion between pickup and drop-offs.
The Michigan Ride Paratransit app addresses problems identified by riders and transit agencies. It will help paratransit riders easily book their rides, especially in instances of cross-agency coordination, and communicate their pickup location to help drivers navigate to the correct location, with What3Words integration in Fall 2020. The What3Words addressing system will help make the process easy in facilities such as VA hospitals, which often have multiple pickup and drop-off zones, or large shopping centers.
What3Words technology is also important for rural locations that might not be included in mainstream mapping apps.
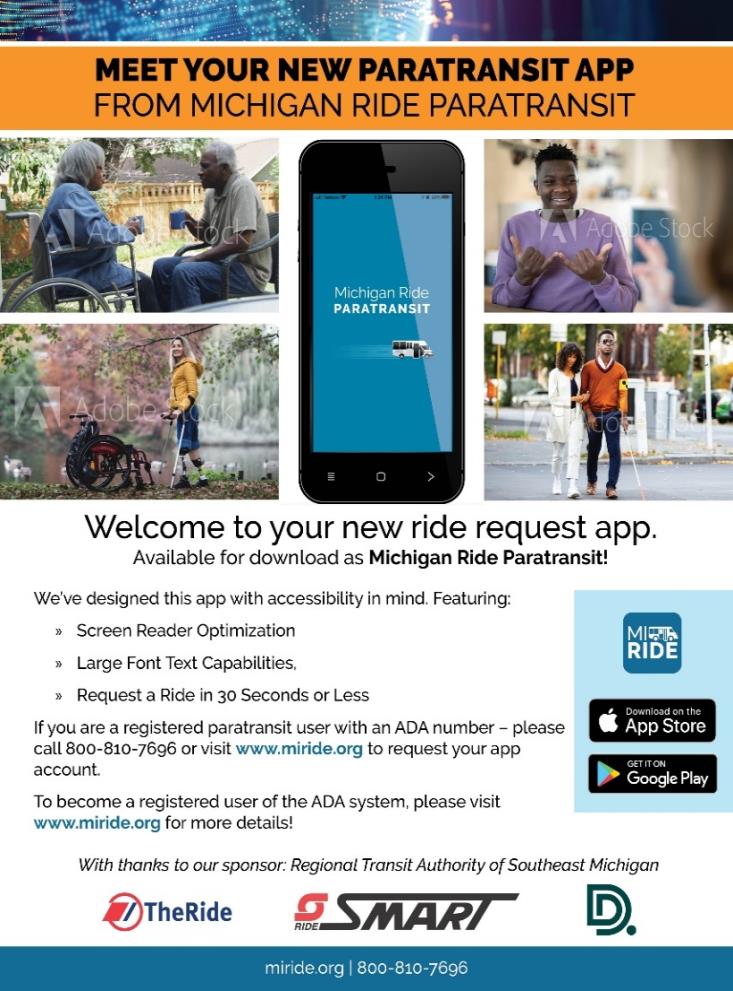
The final version of the Michigan Ride Paratransit app will not require many resources from the transit agency side, other than the to intake and dispatch the rides. Within the scope of the Michigan Mobility Grant, Feonix will finish the app and support the app’s large-scale rollout in Fall 2020. Rollout support includes overseeing dispatch and assisting the agencies that are training new staff while rolling out the new technology. In addition, maintenance will be provided on the technology through September 2021.
Stakeholders provided critical input throughout the development of the technology. In the initial planning period, three focus groups of agency leaders, disability advocates, transit agencies, and community leaders were engaged. In addition, Menlo Innovations was brought into to provide High-Tech Anthropology, a proprietary method of gathering feedback for software design in which they conducted a wide variety of interviews with transit agency staff and riders.
Moving forward, Feonix is working with partner agencies to establish baseline metrics and metrics of progress for the deployment. These metrics include: ride booking time; app complaints; the number of users booking rides; app downloads; number rides per month; the percentage of overall rides per month booked via the app; multi-agency rides, the percentage of multi-agency rides, the number of riders that book a second ride after the first one; and app satisfaction.
Challenges
Developing a technology-based solution for three separate transit agencies comes with challenges. Each agency has a different service design, service areas, and different trip booking policies. Some agencies allow riders to book paratransit services two days in advance, but for preferred ride times or on weekends, even more advanced notice might be needed to ensure there is capacity on the system. Each agency also uses a different booking software.
The booking technology is currently supporting the booking experience. In the full vision, the driver will know exactly where the passenger is at the pick-up location in real-time, using What3Words to complement any challenges where the passenger and driver are trying to find each other. This advanced locational functionality will require integration with the transit agency providers and their dispatching platforms that are not currently planned. The first priority is addressing dispatch and pick-up locational needs now, and once that process has been streamlined and business case proven, the agencies will explore options for enhancing the product.
Early Takeaways
Although the Michigan Ride Paratransit has recently launched with beta users, the pilot project has benefited from frequent and clear communication between stakeholders and the High-Tech Anthropology process with Menlo Innovations. Their extensive research on agency and customer preferences laid an incredible foundation for the future lines of communication to move the project forward. Feonix recommends that any agency that is working with tech startups or pilots consider how a pilot project will change over the course of development and implementation and that a frequent and well thought out internal and external communication plan helps assure that projects move forward successfully.
For More Information
Valerie Lefler, Executive Director, Feonix – Mobility Rising, valerie.lefler@feonixmobilityrising.org https://feonixmobilityrising.org/
Finnish mobility company and vendor partner Kytti: https://www.kyyti.com/
Menlo Innovations: https://menloinnovations.com/services/high-tech-anthropology
Blue Lake Rancheria Transit System Waste Oil to Fuel
Promising Practice: Conversion of on-site waste oil to fuel program developed through university partnership.
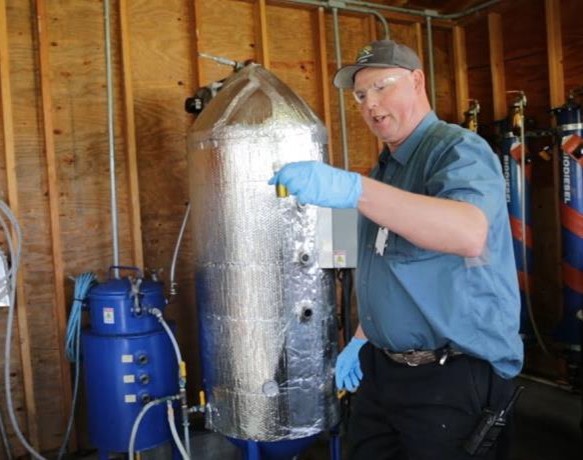
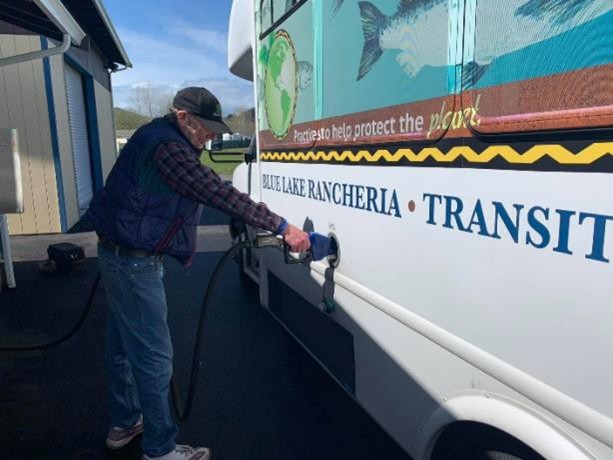
In 2014, Blue Lake Rancheria Tribe began construction of a biodiesel conversion apparatus that takes waste cooking oil from the Tribe’s hotel and casino kitchens and converts it into biodiesel. Blue Lake Rancheria Transit System (BLRTS) began powering their buses using the biodiesel by 2015. The entirety of the Tribe’s sustainability program, which includes a solar-powered microgrid and electric vehicle infrastructure in addition to their waste oil to biofuel program, is spearheaded by the Director of Sustainability and Government Affairs, Jana Ganion. Ms. Ganion has been with the Tribe for more than 15 years and has dedicated her career to reducing the Tribe’s carbon and overall environmental footprint. In 2014, the Tribe was federally recognized as a Climate Action Champion.
Context
Blue Lake Rancheria began operating its deviated fixed-route bus service in 2000. In 2014, Blue Lake Rancheria partnered with Humboldt State University and Schatz Research Center to work on making their transit system more sustainable and reduce costs. The resulting program is a waste oil to biodiesel conversion system, which takes the waste oil from commercial kitchens at the Rancheria and converts it into fuel for buses. Biodiesel made from cooking oil resulted in an 86 percent reduction in greenhouse gas emissions compared to traditional petro-diesel. Their biodiesel is converted on-site and mixed at a rate of 20 percent biodiesel and 80 percent petro-diesel, which yields a B20 biofuel blend.23 The fuel can be used in commercial buses without requiring any vehicular retrofitting.
This practice started as a student engineering project at Humboldt State University, which provided Blue Lake Rancheria with the costs and benefits of switching to biodiesel. While the primary motivation behind the biodiesel program implementation is the Tribe’s goal of reaching carbon net neutrality by 2030, the switch has also reduced operating costs.
State of the Practice and Trends
BLRTS currently operates between two and four buses at any given time, and a B20 biodiesel blend powers the entire fleet, while the conversion of waste oil into fuel and mixing are done on-site by the Tribe. According to Ms. Ganion, the B20 blend is the highest concentration of biodiesel that the vehicles can run on without any alterations to the existing buses. A B40 (40 percent biofuel) or B100 (pure biofuel) blend would require adaptations and negate the bus warranties.
Ms. Ganion stated that they had considered the possibility of expanding their program to produce more biofuel – the Tribe currently makes a few hundred gallons of fuel each month. The expansion would involve both upgrading the apparatus as well as expanding the supply of waste oil. Now, the agency receives all of the waste oil used in the biofuel process from the Tribe’s commercial kitchens, and the program is paid for as part of the Tribe’s general fund. To expand this practice, BLRTS would need to secure an additional source of waste oil, and there are two major concerns with this. The first is that waste oil is a commodity, so the Tribe would have to an expensive purchase of waste oil from other commercial kitchens. The second is that the Tribe has a level of control regarding the quality of the waste oil that comes from their own kitchens. They know what contaminants are potentially mixed in and can regulate the types of oils used. The same is not true if the oil was to be purchased from an outside source. Any additional contaminants or varying properties can make the waste fuel to biofuel process more difficult and impact the quality of the resulting biofuel.
Resources
The Tribe relied on grants from the FTA to purchase their biodiesel conversion apparatus and on technical expertise from Humboldt State University, Schatz Research Center, and the Office of Indian Energy. The Tribe has a strong relationship with their biodiesel equipment provider, Tennessee Diesel, which provides technical advice in addition to parts. Ongoing maintenance is handled and funded internally by the BLRTS.
Ms. Ganion emphasized that the most important resource to ensure a successful implementation of a similar biofuel program is a steady, consistent stream of waste fuel. This could either be in the form of a consistent source of waste oil that is then converted on-site or a consistent source of already created biofuel. Getting all the biofuel from the same source ensures consistent quality biofuel. Also, it is not recommended that engines change types of diesel – once the bus starts to run on B20 biofuel, it should continue to run on B20 biofuel. There must always be a source of consistent, high-quality biofuel to prevent mechanical issues with the vehicles.
The advantage of mixing biofuel on-site is cost savings. When purchased in its final state, biodiesel can be as expensive as traditional petro-diesel or, depending on the biofuel source, slightly more economical. BLRTS has enjoyed greater cost savings from their biofuel program because they get free waste oil from their own kitchens. Even with the cost to purchase a conversion apparatus and convert the fuel on-site, the Tribe still saves money on fuel.
Barriers and Challenges
When Blue Lake Rancheria was conducting initial research into the implementation of waste oil to biofuel process, there were very few existing systems to research as case studies. They relied heavily on engineering students to conduct the initial research into costs and benefits for different types of conversion systems. Despite the difficulty with finding comparable case studies, Ms. Ganion stated that the actual process of converting waste oil into biodiesel has been very smooth.
One challenge Blue Lake Rancheria noted was related to biofuel storage. According to Ms. Ganion, biofuel can be stored for a few months only, which means it is imperative to have a steady supply of biofuel balanced with the amount that is used. Biofuel can degrade and coagulate when sitting for extended periods. In addition to the limited shelf life, biodiesel also does not work as well in cold climates due to the properties of the waste oil. When it gets too cold, the fat in the oil starts to coagulate and can clog an engine. These characteristics are important to be considered when evaluating a waste oil biofuel application.
Results
Since the practice was adopted, Blue Lake Rancheria has been able to reduce its annual fuel costs by approximately $5,000 and its greenhouse gas emissions by 20,000 pounds per year. The biodiesel adoption allowed the Tribe to decrease transit operating costs and further its goal of carbon net neutrality by 2030, which will likely be achieved five years ahead of schedule.24 Among all of the Tribe’s sustainability programs, they have managed to reduce their energy costs by $200,000 per year and have reduced their emissions by 40 percent since 2014. The Tribe has received multiple awards for its sustainability efforts, including recognition as a Climate Action Champion in 2016 and the EPA’s Green Power Leadership Awards in 2019.
For more information
Contact Jana Ganion, Director of Sustainability and Government Affairs at Blue Lake Rancheria jana.ganion@bluelakerancheria-nsn.gov
Blue Lake Rancheria:
https://bluelakerancheria-nsn.gov/initiatives/transportation/
https://bluelakerancheria-nsn.gov/initiatives/sustainabilityandresilience
24 Times-standard.com. 2020. Blue Lake Rancheria Receives EPA Award For Green Energy Leadership – Times- Standard. [online] Available at: https://www.times-standard.com/2019/09/06/blue-lake-rancheria-receives-epa-award- for-green-energy-leadership/ [Accessed 5 August 2020].
Clemson Area Transit – Electric Bus Fleet
Promising Practice: Catbus electric bus fleet represents half of its entire fleet showing substantial operating savings.
Clemson Area Transit (CATbus) was founded in 1996 and serves the towns of Clemson, Central, Pendleton, and Seneca in northwest South Carolina. CATbus is the largest fare-free bus service in the Carolinas, serving around 2 million passengers per year. In 2014, CATbus started operating electric buses, in 2017, with the addition of 10 Proterra buses to its electric fleet, its electric fleet accounted for 50 percent of its total bus fleet.
Context
The electric bus program at CATbus was introduced in 2010 as part of a larger program to reduce energy consumption and increase energy efficiency. Electric buses were included in this program in response to poor air quality and a desire to cut operational costs at this fare-free system. The program was facilitated by a partnership between CATbus, the City of Seneca, the Center for Transportation and the Environment, and SCDOT. CATbus also formed a strong relationship with South Carolina-based Proterra, one of the largest electric bus manufacturers in the United States.
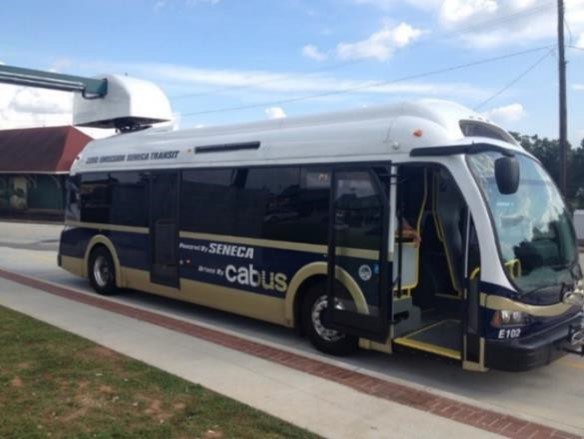
The implementation of emerging technology can be challenging as the first few generations of vehicles are perfected. The first set of buses that CATbus purchased in 2014 had a few technical issues that required resolution. However, the technology has matured vastly in the last six years, and the issues experienced in 2014 did not recur when the second order of buses arrived in 2017. The original CATbus electric bus program included electric buses and two chargers, a primary and a secondary. These fast chargers do not require the buses to be plugged in; instead, the driver simply drives underneath the suspended charger. The back-up second charger was located at a hospital so that the charger would have emergency power in the event of a disaster.
Resources
The first phase of the process was completing an electric bus study to determine the applicability of the electric bus program. Four years later, the original four buses were purchased using a 4.1 million-dollar TIGGER grant (Transit Investments for Greenhouse Gas Reductions) and a 1.8 million-dollar Bus Livability Program grant.25 In addition to buses, this grant also purchased two fast-charging stations. In 2017, CATbus purchased an additional ten buses with a 3.9 million-dollar Low or No Emissions grant from the FTA.
Results
The program is considered to be an absolute success by CATbus. The buses have surpassed their original expectations in function and efficiency. Fuel costs were cut in half, and maintenance costs have reduced by two thirds with the implementation of electric buses. The buses get 16.8 miles per gallon equivalent and cost $0.28 per mile to operate. The bus batteries have lasted longer than anticipated, and the vehicles are cheaper and easier to maintain compared to diesel buses.
Since the implementation of the program, the electric buses have reduced diesel consumption by approximately 40,000 gallons per year. Thanks to those electric buses, 2.7 million pounds of net CO2 were not emitted. CATbus plans to go fully electric by 2025.
Lessons Learned
The keys to the success of the all-electric model, according to CATbus, are:26
- Ensure adequate funding to start the conversion to electric service.
- Get information from agencies that are using the technology – CATbus was invited by Doran Barns to visit Foothill Transit to see electric buses on route and talk to the staff.
- Determine the electric rate structure and use rate modeling in the planning.
- Study the route modeling data to determine the type of bus for the route, i.e., Quick Charge or Extended Range buses, and consider:
- Round trip mileage of the route
- Daily total mileage
- Topography
- Route schedule, timing
- Possible location of charging stations
- Shadow the diesel buses with different vendor’s vehicles to see if the model works before going out for bid.
- Make the bid include the needs that have come out of the route study.
For more information
Contact Sammy Grant, General Manager, Clemson Area Transit, sgrant@cityofclemson.org TCRP Report 219: Guidebook for Deploying Zero-Emission Transit Buses: http://www.trb.org/Publications/Blurbs/180811.aspx
Financial Analysis Of Battery Electric Transit Buses, NREL: https://afdc.energy.gov/files/u/publication/financial_analysis_be_transit_buses.pdf
25 City of Seneca, SC. “Electric CATbus” available at: http://www.seneca.sc.us/AboutSeneca/PublicTransit/ElectricCatBus.aspx, as of August 31, 2020.
26 Moody, K. (2019). Save $, Save Energy, Save the Planet [Conference presentation]. Sustainable Fleet Technology Conference and Expo 2019 https://static1.squarespace.com/static/584598d4d1758ec839a47bab/t/5d66d9592d18f0000123aae5/1567021410821/3 C_MoodyKeith_ClemsonTransit.pdf
Mountain Line – Transit Asset Solution
Promising Practice: Shifting work orders from a paper-based to a smartphone application and cloud-based system that facilitates transit asset management decision-making.
Mountain Line uses an IoT-enabled Transit Asset Management (TAM) system, ThingTech, to improve the maintenance work order process by reducing manual data entry. In the second implementation phase, which will begin in Summer 2020, ThingTech will be implemented across Mountain Line’s divisions as a singular solution for asset management and help Mountain Line with the FTA’s State of Good Repair reporting requirements.
Context
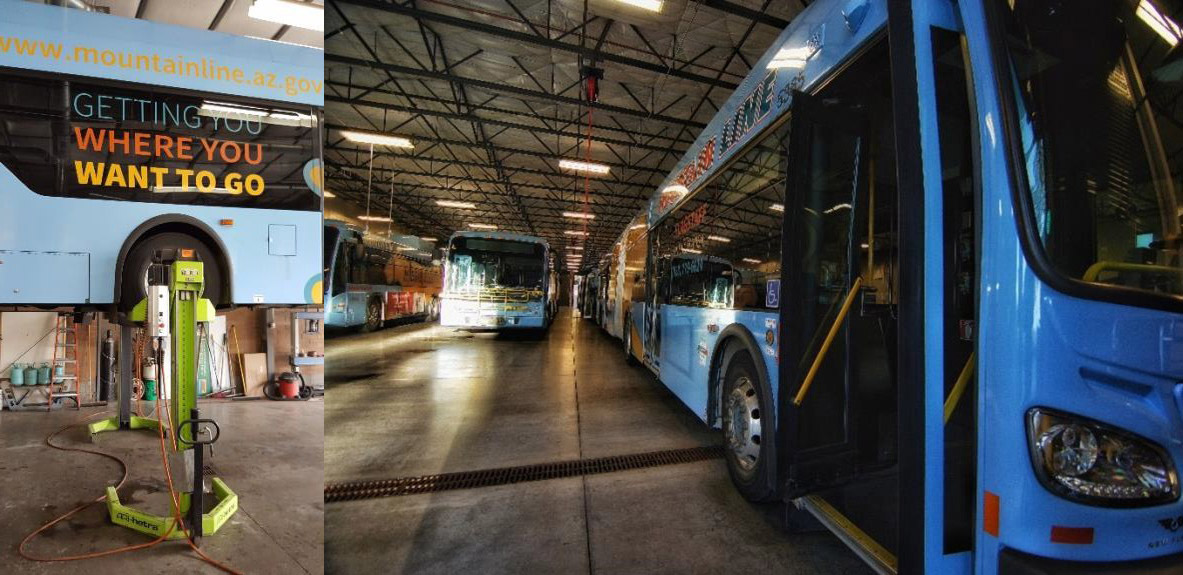
Mountain Line implemented ThingTech to make the work order process easier and more efficient. Before ThingTech, Mountain Line’s Facilities Division tracked work orders manually on paper and entered them into a spreadsheet. Wade Forrest, Mountain Line’s former Facilities Manager, was involved in the previous manual entry process and ThingTech’s initial implementation. The Facilities Division was interested in an asset management solution that would: eliminate manual data entry on the 10,000 work orders they process annually; support capital improvement and grants, handle fleet work orders, parts inventory, and facilities information; and track IT assets. When a new 25,000 square foot storage and maintenance building was completed in 2015, Mountain Line used a capital grant to fund an initial three-year subscription to ThingTech to support the building’s onboarding. In this initial implementation phase, Mountain Line deployed the solution in a limited fashion only for the Facilities Division’s work order and asset tracking tasks.27 ThingTech’s full features will be expanded and used to unify asset management throughout the agency in the forthcoming second phase.
Resources
Mountain Line relies on human and financial resources for its ThingTech implementation and expansion. Members, from the Business Manager to staff in the Facilities and Fleet Divisions, joined the Implementation Team to provide detailed feedback during the initial development process and to ensure that ThingTech would meet their needs and expectations. This early and continued involvement helped improve staff buy-in when ThingTech was rolled out.
After roll-out, the staff needed to learn how to use the solution. Mr. Forrest reviewed early information that the team captured in the system and identified data entry errors, particularly those related to time. In response, he scheduled weekly meetings with each member to review the data, improve entry, and reduce and correct errors. Finally, in terms of financial resources, a capital grant funded the initial phase, and Mountain Line finances its continued use of ThingTech as part of its operating budget, spending $30,000 annually.
Barriers
The nature of a large systematic change was one barrier Mountain Line faced. Individual staff members needed to learn a new way of managing work orders and a new workflow after years of the manual process. Although change is sometimes painful, most staff saw the benefit of the new system and how it could serve them and the organization. Continuous stakeholder engagement and support from senior leadership were essential to the implementation.
Results
Mountain Line has observed some early positive results after the completion of phase one. Approximately 95 percent of the Facility Team’s total work orders are being tracked in ThingTech. That number includes all work orders related to preventative maintenance (approximately 10,000 work orders annually, the bulk of which are bus stops, and 300-400 work orders related to facilities) and corrective maintenance. Tracking work orders has helped Mr. Forrest see where the team’s time and energy are spent and strategically allocate staff and resources, which simultaneously gives the team time to focus on other tasks and helps them understand when more staff may be required. Finally, ThingTech has helped Mountain Line develop transparency across divisions and, with the implementation of phase two, will help the agency take a unified approach in applying for funding and prioritizing repair and replacement of capital infrastructure in the future.
In the second implementation phase, the fleet and IT inventory will be added into the system, and ThingTech will also be used to track Fleet Division work orders. The phase two implementation should also yield results that can be used for FTA reporting requirements and data mining for strategic decision- making across the agency. Mountain Line will use ThingTech to track asset conditions according to the TERM-Lite scale and add financial and grant tracking information into the system, which will support planning and accounting processes.
Lessons Learned
Mountain Line has several recommendations for other agencies interested in implementing a similar solution. Management had the same learning curve as staff but also needed to understand the administrative side of the solution. This included the need to develop Standard Operating Procedures for data governance to ensure that data was entered accurately by the individuals responsible for its collection and entry. Managers at the agency also needed to learn best practices for adding new transit routes and their accompanying assets into the system and assuring the data was entered correctly. Strong project management skills were required to implement a system of that size in addition to a clear, defined, and unchanging scope that guided the implementation.
As part of the project management process, Mountain Line conducted stakeholder interviews within the organization to develop a scope statement that was then used to guide the work with ThingTech in the development of the TAM solution.
Agencies also need to choose between cloud-based or in-house storage solutions, both of which carry their costs. In Mountain Line’s case, the cloud-based solution, despite the annual storage and maintenance costs, was a better fit than in-house storage, which requires servers, as well as other infrastructure and dedicated IT staff. Although some agencies may be concerned about the cost of a solution like ThingTech, Mr. Forrest believes that these types of tools can not only help agencies with FTA reporting requirements but also be considered best practices for asset management that help make smart, data-driven decisions. Mountain Line has had strong support from senior leadership that understands the importance of continued funding for a solution that helps maintain over $30 million in assets and considers the subscription part of the cost of doing business.
27 Mountain Line does not currently use ThingTech for any IoT-related tracking.
Go Vermont! Trip Planner
Promising Practice: Improving access to transit information to include demand- response and volunteer-run services.
Go! Vermont is VTrans’ program to promote alternatives to drive-alone trips, administering a carpool ride- matching service in addition to providing information about transportation options in the state, including the state’s volunteer driver program. In 2018, they launched a trip planner that incorporated both GTFS and GTFS Flex, allowing the trip planner to provide more options than private-sector counterparts. The GTFS Flex function is especially useful in the rural parts of the state, where fixed-route bus services are less common than demand-response services. In 2020, the agency upgraded the trip planner to include more modes, which allows users to plan both peak and off-peak trips.
Context
As a rural state, fixed-route transit service is challenging to provide in many areas, which leads to challenges accessing essential services for many Vermonters, especially those who are older or disabled, without access to private vehicles. The state makes heavy use of demand-response and volunteer driver services to meet these transportation needs. Still, existing trip planning services omitted those services, meaning that many Vermonters were unaware of the options available to them.
Trillium, a data-focused transportation consulting firm, helped VTrans create GTFS-Flex data for its demand-response services, and then helped to create an initial trip planning application for Go! Vermont. In 2020, upgraded the trip planner with the help of vendor AgileMile to include additional transportation options. As AgileMile was already providing a trip-tracking app to Go! Vermont, this upgrade also integrated the trip planning and trip tracking apps, providing both functions in a single app for the first time in Vermont.
Organizations representing elderly and disabled Vermonters, such as the Vermont Association of the Blind and Visually Impaired and the Vermont Center for Independent Living, were heavily involved in the process of developing and marketing the application. These organizations and their constituencies are considered key target audiences for the trip planner app. Beyond the development phase, these organizations continue to submit feedback to VTrans with suggestions for app updates and improvements.
State of the Practice and Trends
While VTrans was the first state transportation agency to implement a trip planning tool with GTFS-Flex capabilities, such practices are now more and more common. In the Washington, DC metropolitan area, the IncenTrip28 app is being used to both plan and track trips for transportation demand management (TDM) purposes. Some trip planning tools, such as the EZFare system launched by a consortium of Ohio and Kentucky transit agencies called NEORide,29 now also include fare payment capabilities as well. Go! Vermont itself has assisted in driving the state of the practice forward, making the code that powers its trip planner app open source and available to any agency that wants to use it through the GTFS-Flex Github repository.
Resources
Initial funding for the trip planner was provided by a United States Department of Transportation (USDOT) Federal Transit Administration (FTA) Mobility on Demand Sandbox grant. VTrans complemented FTA’s $480,000-grant for the development of the tool with an additional $120,000. The state also pays about $30,000 per year to transportation consulting firm Cambridge Systematics to maintain the trip planner, which comes out of Go! Vermont’s roughly $800,000 annual budget.
Go! Vermont Program Manager Dan Currier noted several other resources Go! Vermont drew on to help create the trip planner tool. One of these was the program’s existing strong partnership with employers and Transportation Management Associations (TMAs) throughout the state. Another was the availability of reliable data on both fixed-route and flexible services in the state. Trillium’s help in developing GTFS-Flex data for demand-response services in Vermont was a key building block in making the trip planner a reality, but developing that GTFS-Flex data can be a resource-intensive process.
Barriers
For Go! Vermont, developing and deploying this trip planner was just one piece of a broader effort to encourage more people to use alternatives to driving alone. While the trip planner does help people learn about their transportation options, it has yet to fuel significant change in mode choice in the state. Go! Vermont representatives reported that a critical barrier to the increased use of non-car options is a common mindset that everyone drives everywhere, so people don’t often consider alternatives to driving unless they have no other choice. For Go! Vermont, this mindset is a key barrier they need to overcome, and they see the trip planner as one tool to help them do that.
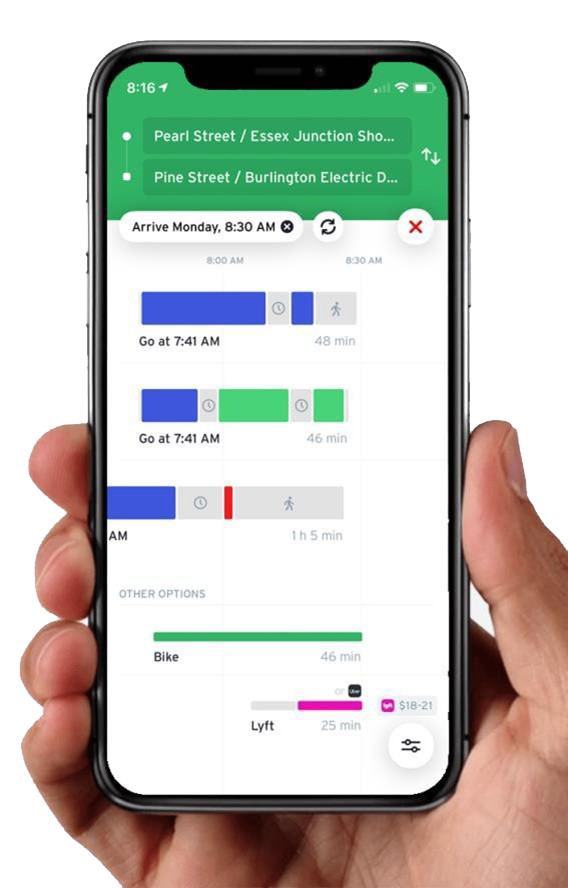
Go! Vermont has also struggled to get members of the public to use the app. When they originally launched the app in 2018, they promoted it via several different media channels, including radio, television, social media, and an online community news service local to Vermont called Front Porch Forum. These initial outreach efforts were marginally successful. Because Go! Vermont did not roll out the new version of its trip planner until after the COVID- 19 pandemic, and related stay-at-home orders, had already reached Vermont. They chose to take a “light touch” with promoting the new version of the tool, focusing on AgileMile’s trip tracking tools and the ability to earn rewards by teleworking. The agency has seen some success with this and hopes to promote the tool more aggressively once conditions no longer necessitate travel restrictions.
Results
Go! Vermont is still in the process of determining how to evaluate the success of the trip planner app. While the tool has not seen as much use as VTrans had hoped, and has had only small successes in changing travel behavior, the project has been a key step forward in developing the knowledge and technology to allow trip planning tools to incorporate flexible transit services, and many other agencies have built on this to provide similar tools with additional features.
Lessons Learned
Mr. Currier pointed to several lessons learned that might help other agencies trying to implement a similar tool. They noted missed opportunities in the initial planning phases, such as the lack of established measures of success, which made program evaluation difficult later on, as well as insufficient knowledge about why their desired end-users make the transportation choices they do, which made it more difficult to leverage the tool to change travel behavior. In terms of Go! Vermont’s successes, one crucial element that enabled the project to be undertaken in the first place was building a strong commitment to TDM among state transportation officials and lawmakers. VTrans spent a decade building this support, and they reported that the trip planner tool could not have happened if this groundwork had not been laid.
For more information
Contact Dan Currier at VTrans: Dan.j.currier@vermont.gov.
See N-Catt’s GTFS webinar recording, slides, transcript, and fact sheet: https://n-catt.aura-software.com/tech- university/webinar-gtfs-flex/
The Shared-Use Mobility Center’s writeup of this practice can be found at https://learn.sharedusemobilitycenter.org/casestudy/vermont-flexible-trip-planner-bringing-fixed-and- flexible-transit-together-on-a-single-platform/.
The Shared-Use Mobility Center’s writeup of the NeoRIDE platform can be found at https://learn.sharedusemobilitycenter.org/overview/trip-planning-ticketing-app-launched-for-10-transit- agencies-oh-2019/.
Portneuf’s Smartphone CAD/AVL and Fare Collection System
Promising Practice: Using a smartphone to geolocate vehicles, a cad/avl Module integrated with a fare collection solution allows a provider to see from one webpage operational and ridership data in real-time.
Context
The search for an alternative to paper-based monthly passes was the impetus behind the adoption of the smartphone, cloud-based CAD/AVL, and fare collection systems. CTRP started offering monthly passes for its commuter route riders even before selling passes online and installing electronic fare collection equipment to its vehicles. Due to its large service area and numerous cities served, the process of distributing passes for sale was very labor-intensive to the agency, requiring monthly visits to each one of the over 20 selling locations.
A year-long, unsuccessful search for a local electronic fare payment vendor in Quebec preceded the current solution adoption. CTRP was looking for fare payment solutions that would allow riders to register and recharge smartcards online, but all solutions offered by Canadian vendors ended up being too complex, designed for large transit agencies, or unaffordable. A year into the search, the General Director at CRTP, Maryse Perron, watched a presentation by vendor Ubitransport and was attracted by the simplicity of their solution. Based in France, Ubitransport develops integrated cloud and smartphone intelligent transportation solutions for public passenger transportation systems, and among its solutions is a CAD/AVL module that integrates with an account- based fare collection system.
Equipped with an off- the-shelf smartphone or tablet, each vehicle is geolocated, while the power of CAD/AVL gives access to operational data feeds in real-time.
Ubitransport’s CAD/AVL module integrates natively with the fare collection solution. These two modules combined make real-time data available back in the office from one webpage that includes the vehicle’s load factor, the number of boardings at each stop point, and the ability to cross-check fares of those who pay cash, to name a few capabilities. While in the vehicles, drivers can follow early or late indicators, remaining distance on the route, correct stop points, information on riders, and more. If there are unplanned events on the route, they can also send messages to back-office administrators.
Resources
CTRP purchased all CAD/AVL and fare payment equipment and maintains the service with agency operating funds surplus. Canadian transit systems, in general, rely much more heavily on fare revenue to fund operational and capital expenses as compared to American providers. There are no dedicated public funding sources for transit technological improvements in Quebec. Capital investment decisions regarding the purchase of a new vehicle, for example, limit their capacity to invest in technology. In this context, a light, affordable solution to fare collection technology was imperative, and all the equipment necessary for the solution chosen is an off-the-shelf smartphone, a small printer, and a smartcard reader.
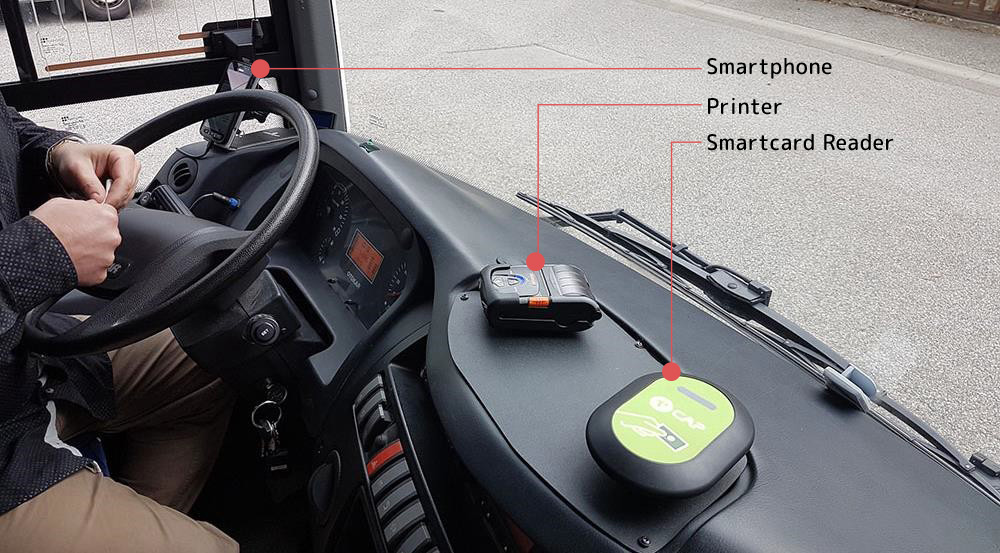
To take full advantage of the CAD/AVL capabilities, CRTP would ideally have a staff member dedicated to controlling the operations in the office. However, with a team of three staff, the agency doesn’t currently have the resources to dedicate making to real-time operational adjustments from the office. Currently, CRTP only processes part of the information available to them through the CAD/AVL and fare payment systems. Ms. Perron noted that data analysis could be a time-consuming task for their team, yet CRTP makes use of several standard statistics reports offered by the system.
Results
The solution made operations easier and pleased the riders. Among younger riders, online smartcard recharges and real-time bus tracking via the mobile app are exceptionally successful, according to Ms. Perron. While CRTP believed that the overwhelming majority of the riders would be using smartcards by the second year after adopting the technology, this did not happen. With transit services designed for older adults (who are the majority of CRTP riders), 80 percent of those riders still pay fares with cash, despite CRTP offering smartcard recharges via phone using credit cards in addition to the numerous stores in the region. Regardless, the solution decreased dwell times with drivers receiving fewer cash payments and made the monthly visits to physical stores a twice-a-year activity for CRTP staff.
The electronic fare payment technology with the vehicle geolocation has provided CRTP the means for service optimization. Beyond a route-level on-time performance measure or passenger counts, the technology allows CRTP to easily access information such as an underused stop or stops where the bus is frequently late or ahead of schedule. A better performance monitoring system informed CRTP to optimize route itineraries and consolidate stops. AVL alone is also key for providing real-time passenger information and tracking operations, allowing staff to track in real-time eventual reroutes due to roadwork or accident, for example.
Lessons Learned
The implementation process was twice as long as the technology vendor anticipated. Ubitransport suggested a three-month implementation period when staff from France would be based in Canada setting up the system and able to respond to any unexpected event without a six-hour time zone difference. One of the reasons for an extended implementation period was adjustments to the product-set up need to account for differences in how transit is structured in France and North America. However, a six-month implementation period proved necessary, and CRTP staff needed another six months to gain confidence in using the system.
Ubitransport’s technology is widely adopted in rural France while emerging in Canada with CRTP and the city of Saint-Jean- Sur-Richelieu as the two first agencies to adopt the complete CAD/AVL, electronic fare collection, and RTPI solutions in North America.31
The implementation period is particularly critical for training drivers to navigate the smartphone system. Ms. Perron stressed the importance of engaging drivers since the early stages of the practice adoption, saying that drivers need to be on board with the changes as they play a critical role in operating the system. Drivers are the ones logging the trip information, starting and ending a trip, and manually entering cash payments in the smartphone system. Therefore, high-quality statistics are closely associated with the proper navigation of the smartphone system by the driver.
The product offered in Europe required small changes for the North American application. A printer on the vehicle is useful in rural France where a printed proof of payment is common practice for time-based fare charging or transfers between modes. However, in North America, the printer is hardly ever used since riders decline printed receipts and time-based fare charging is rare. Another adaption was needed regarding passenger information, with Ubitransport and Zenbus partnering to offer an RTPI application better suited for the North American public.32
For more information
Contact Isabelle Cloutier, Ubitransport’s Canada and United States representative, at i.cloutier@ubitransport.com
Ubitransport’s website: https://www.ubitransport.com/
CRTP’s website: http://www.transportportneuf.com/
30 https://www.ubitransport.com/wp-content/uploads/2018/09/ubitransport-quipe-la-ca-privas.jpg
31 Ubitransport, Saint-Jean-Sur-Richelieu, the first city in Canada to deploy our solution, available at: https://www.ubitransport.com/saint-jean-sur-richelieu-the-first-city-in-quebec-to-deploy-our-solution/?lang=en, as of August 31, 2020.
32 Ubitrasport, Ubitransport et Zenbus rapprochent leurs savoir-faire au service de la mobilité des territoires, available at: https://www.ubitransport.com/ubitransport-et-zenbus-rapprochent-leurs-savoir-faire/, as of August 31, 2020.
Mobile Fare Payment Technologies
Promising Practice: Enabling mobile fare payment for small and rural public transportation systemssystems.
Mobile fare payment allows riders to purchase transit rides via a smartphone app linked to a credit card or user account (often called an “account-based system”) and provides a digital ticket or other scannable code to validate proof of purchase. Mobile payment makes transit use easier for riders, especially for regional travel if multiple agencies share the same platform; reduces cash payments and the exchange of cash; and is easily validated by transit operators by sight. Although the first mobile fare payment system in the US was established in 2011, most agencies where mobile fare payment options are in use have released their apps since 2015.33 The rise of the subscription-based or Pay-as-You-Go models provide agencies of all sizes the opportunity to use a cloud-based subscription service to manage fare payment as opposed to customized systems.34 In the long-term, transit agencies might progressively integrate other public and private transportation modes, such as micromobility and TNCs, into one platform that users could book and pay for through the app. Additionally, other third-parties, such as health and human service agencies, may also be integrated into a mobile fare system to coordinate fare payment for benefit recipients.35
Context
Mobile fare payments can improve the fare payment experience for the rider and fare management experience for the transit agency. Riders can easily download a fare payment app to their devices, and, generally, these payment apps also include real-time travel information and trip-planning tools for riders in one convenient location. Depending on the app’s setup, riders might even be able to access any special fares available to them, such as student or senior rates. An agency may also elect to add a fare capping capability into an app, which means that once riders have paid enough regular fares equivalent to the cost of a monthly pass, for example, they wouldn’t pay any additional fees for the remaining calendar month. Furthermore, mobile fare payment systems may facilitate regional collaboration and scale according to need. EZfare, a cashless mobile ticketing app created by vendor Masabi and launched
for seven Ohio transit agencies, launched in 2019.36 Using one app, riders could purchase transit fares for any of the participating agencies. EZfare expanded to cover thirteen agencies in Ohio and Kentucky in late 2019 37 before another expansion covering fifteen systems and integration with the Uber app in 2020.38
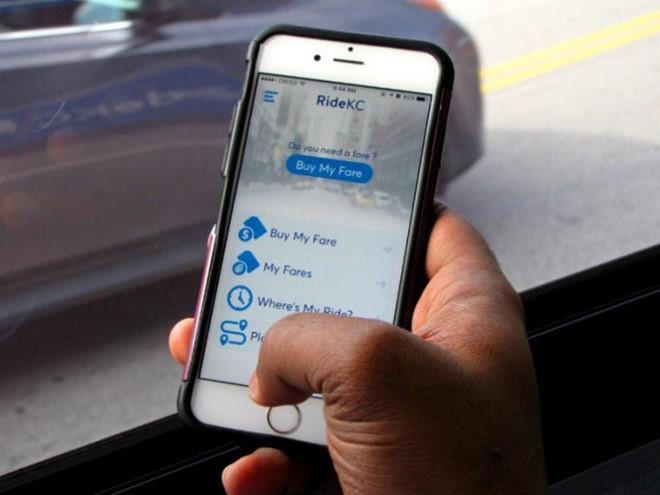
Mobile fare payments address operational concerns for transit agencies, as they can speed up the boarding process and reduce dwell times. Drivers do not have to wait for riders to insert the correct cash into a farebox or provide paper tickets. Agencies can produce fewer or no physical media for payments such as tickets or stored value cards, which reduces costs.39 Additionally, the COVID-19 pandemic has shown the importance of contactless payment. LANta, which serves Pennsylvania’s Lehigh and Northampton counties, was originally interested in how the switch to mobile fare payment would expedite boarding. However, during initial COVID-10 contingency planning, the agency recognized how the technology could reduce the exchange of cash – and potentially germs – between drivers and riders.40 Lastly, mobile fare payment systems provide agencies with the flexibility to set up and change fares, loyalty or rewards programs, or other special fare programs easily and have minimal up-front costs depending on the chosen fare validation method.
Agencies should consider how mobile fare payments may impact riders:
Apps should integrate accessible features such as high-contrast text, large text, and connectivity to hearing aids.
Since mobile fare payment will collect riders’ personal, trip data, and payment information, systems will need to be secure.
Transit agencies need mechanisms to validate fare products purchased through the mobile fare payment app. According to a survey with over 60 transit providers in the US and Canada, the vast majority of mobile fare validation is conducted by drivers that see a mobile ticket displayed on a smartphone screen. Quick response (QR) codes or barcodes that riders scan are other validation methods.40 TouchPass, a Fare Collection-as-a- Service digital platform, for example, provides a QR code that can be scanned upon entry, requires no contact, and is linked to a user account that includes payment information.41 Those systems can also collect validation information across payment methods, such as smartphones, student IDs, smart cards, and paper QR codes. More than two dozen U.S. transit agencies currently use TouchPass, including recent implementation in the City OF Billings, Montana, where the COVID-19 pandemic and brought to the fore the need for contactless and quick fare collection.42
State of the Practice and Trends
Mobile fare payment companies are working with agencies of all sizes across the world. Token Transit works with 94 agencies across the United States and Canada and Masabi’s Justride with over 80 agencies in 11 countries. 43, 44 Ubitransport has a light account-based fare collection system widely adopted in rural France and a couple of small systems in Canada.45 Other companies are operating in this space for which public-facing client information was not readily available. However, many vendors strive to provide solutions that are easy to use and provide detailed rider data with low or no upfront costs and scalability that can meet agency needs.
Resources
Agencies implementing mobile fare payment systems rely on human, financial, and technological resources. The agency would need to understand their needs and select an appropriate payment solution, which may be limited based on available levels of funding. There are several business models and contract types for mobile fare payment. Still, vendors tend to handle mobile app development, payment processing, and compliance requirements and are paid based on a percentage of sales.33 Transit agencies tend to address customer service and marketing the fare option.33 Agencies can also choose from an off- the-shelf app with fewer customizations that might be used by several agencies, or a so-called “white label” app which is designed to look like it was made by the agency, albeit it at a higher cost. Since most mobile fare payment systems are cloud-based, agencies do not need additional physical, in-house IT infrastructure. Drivers and riders must be trained to learn how to use mobile fare payment systems. If other validation methods than visual checks are to be used, agencies may also have to consider capital expenditures to update existing fareboxes or install new fare readers on vehicles.
Key Findings
Scholarly research on mobile fare payment is limited, as is transit agency data that quantify its impact. A study46 among bus riders in Florida found that riders spent less time buying tickets and experienced reduced boarding times. In the same study, drivers spent less time validating fares and also noted reduced boarding times. In a pilot project in Florida, riders downloaded an app to purchase tickets. Upon the pilot’s conclusion, 75 percent of riders indicated that they were “very satisfied” with the app, although some experienced difficulties with internet connectivity.47 From an agency perspective, TCRP Synthesis 148: Business Models for Mobile Fare Apps asked agencies about the challenges they faced in deploying mobile fare payment. Write-in responses included, “(1) training of frontline staff, (2) customer education and awareness, and (3) a lack of integration either regionally or with their existing fare payment system.33
For more information
Many small-urban, rural and tribal transit systems are rolling out mobile fare payment system. For a couple of examples, contact: Kendra McGeady, Director of Transit, Pelivan Transit/Northeast Oklahoma Tribal Transit Consortium, Big Cabin, Okla., kmcgeady@grandgateway.org
Scott Chancey, Transit Program Supervisor, Josephine County, DBA Josephine Community Transit (JCT), Grants Pass, Ore., schancey@co.josephine.or.us
TCRP Synthesis 125: Multiagency Electronic Fare Payment Systems https://www.nap.edu/download/24733#
TCRP Report 177: Preliminary Strategic Analysis of Next Generation Fare Payment Systems for Public Transportation https://www.nap.edu/download/22158#
TCRP Synthesis 148: Business Models for Mobile Fare Apps https://www.nap.edu/download/25798# https://sharedusemobilitycenter.org/panel-making-mod-happen-through-payment-integration/
33 Transportation Research Board. Transit Cooperative Research Program (TCRP) Synthesis 148: Business Models for Mobile Fare Applications, available at: https://www.nap.edu/download/25798#, as of August 5, 2020.
34 Gooch, J. (2020, February 5). How a new fare payment delivery model is enabling MaaS. Mass Transit Magazine. Retrieved August 31, 2020, from https://www.masstransitmag.com/technology/fare-collection/article/21124088/masabi- us-ltd-how-a-new-fare-payment-delivery-model-is-enabling-maas
35 Shared Use Mobility Center. Panel: Making MOD Happen through Payment Integration, available at: https://sharedusemobilitycenter.org/panel-making-mod-happen-through-payment-integration/, as of August 5, 2020.
36 Masabi. NEORide and Masabi Launch EZfare, available at: https://www.masabi.com/2019/06/25/neoride-and- masabi-launch-ezfare-an-innovative-multi-agency-cashless-mobile-ticketing-app-making-riding-public-transit-easier- than-ever-before/, as of August 21, 2020.
37 Masabi. NEORide, Masabi, and Transit Get People Moving with Multi-Agency Mobile Ticketing app, available at:, as of August 21, 2020.
38 Masabi. EZfare Ticketing Launching with Journey Planning in Uber App for Riders Across Ohio and Kentucky, available at: https://www.masabi.com/2020/07/15/15654/, as of August 21, 2020.
39 Transportation Research Board. Transit Cooperative Research Program (TCRP) Report 177: Preliminary Strategic Analysis of Next Generation FarePayment Systems for Public Transportation, available at: https://www.nap.edu/download/22158#, as of August 5, 2020.
40 The Morning Call. LANTA readies contingency plans as more coronavirus cases appear in Pennsylvania, available at https://www.mcall.com/coronavirus/mc-biz-lanta-coronavirus-ticket-app-20200309-ch4wy355gng3xjp6m5pacp7s4y- story.html, as of August 21, 2020.
41 Cubic. Touch Pass Brochure, available at: https://www.cubic.com/sites/default/files/20-CTS-Cubic%20TouchPass- brochure%20-%20v1%20-%20FINAL.pdf, as of August 5, 2020.
42 Cubic. (2020, August 28). Cubic expands TouchPass Solution to Montana’s MET Transit system. Mass Transit Magazine. Retrieved August 31, 2020, from https://www.masstransitmag.com/technology/fare-collection/fare- collection-equipment/press-release/21152201/cubic-transportation-systems-cubic-expands-touchpass-solution-to- montanas-met-transit-system
43 Token Transit. Bus Passes on Your Phone, available at: https://tokentransit.com/, as of August 5, 2020.
44 Masabi. Justride Mobile Ticketing, available at: https://www.masabi.com/justride-mobile-ticketing, as of August 5, 2020.
45 Ubitransport. What We Do: Fare Collection, available at: https://www.ubitransport.com/what-we-do-fare- collection/?lang=en, as of August 5, 2020.
46 Brakewood, C., Ziedan, A., Hendricks, S. J., Barbeau, S. J., & Joslin, A. (2020). An evaluation of the benefits of mobile fare payment technology from the user and operator perspectives. Transport Policy, 93, 54-66. https://www.sciencedirect.com/science/article/pii/S0967070X19304056.
47 Ibid.
Johnson County, Kansas Flex Service Pilot
Promising Practice: Using flexible service to make first and last-mile connections to fixed-route transit.
In 2019, Johnson County, Kansas, located in the Kansas City metropolitan area, implemented a demand- response service to connect residents to fixed-route transit. The service quickly grew, with the number of vehicles needed to provide the service more than doubling in the space of a few months, spurring ridership growth on the county’s fixed-route services as well. In 2020, Johnson County has simultaneously had to work to ensure that the program continues to meet demand, while also navigating the constraints of COVID-19 related capacity and budget issues.
Context
Johnson County, located southwest of Kansas City, is the economic engine for the state of Kansas, as well as its most populous county. Historically the County has had limited transit service, and today it has an infrequent fixed-route network which, due to Johnson County’s sprawling development patterns, does not reach most county residents.
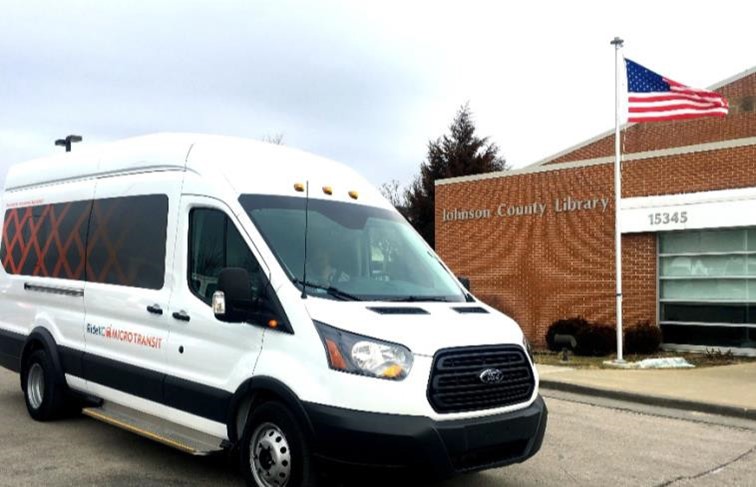
Johnson County’s Flex Service was created to serve two main goals. One was to serve as a first and last-mile connection to the region’s fixed-route network, to connect residents to existing transit options better. The second was to offer additional transit capacity to support the county’s effort to create urban destinations that will attract young adults to move in. Rides cost $1.50 and include a free transfer to fixed-route transit. The first year’s ridership data suggests that riders are using the service for both short and medium distance travel.
To develop the service, Johnson County worked with RideKC, the Kansas City region’s largest public transit agency, and partnered with microtransit vendor Transloc and a local taxi service under their preexisting contracts with RideKC. Transloc provided the software that powers the service, including a mobile app for hailing rides as well as the dispatching software. The taxi service provides additional vehicles to operate the service when the seven vans purchased for the program cannot meet demand.
The service operates Monday through Saturday. The service operates in a roughly 40 square mile area on weekdays, with an expanded Saturday service area covering roughly 60 square miles. These service areas were chosen to take advantage of existing pockets of density in the county, and to maximize connections to the fixed-route system in Johnson County, as well fixed-route services in other parts of the Kansas City metro area. The expanded Saturday service area is intended to improve access to Overland Park, which with a population of nearly 200,000 is the second largest city in the state of Kansas, as well as the second largest city in the Kansas City metropolitan area.
State of the Practice and Trends
Demand-response services have long been offered by public transit agencies all over the United States, particularly in small towns or rural areas with insufficient demand to support fixed-route services. But the expansion of Transportation Network Companies (TNCs) like Uber and Lyft have shown that allowing riders to book at any time through a mobile app can make demand-response transportation viable even in many suburban areas. As a result, demand-response services are being piloted across the country in areas that had underperforming or no fixed-route services.
Resources
The first year of the Flex Service pilot cost Johnson County about $600,000, including just under $100,000 spent to acquire the county’s first three Ford Transit Connect vehicles to operate the service. The cost was carried by the county, using funds earmarked for transportation service. Additionally, the county was able to take advantage of preexisting contracts between RideKC and Transloc as well as one between the county itself and a local taxi service. The Transloc contract allowed for the rapid creation of an app for the flex service pilot, while also ensuring that the app would be customized to meet the county’s needs. The taxi contract, initially designed to provide paratransit rides, became extremely useful when the county found demand for its Flex Service outstripping the number of vehicles it had available for the service, causing wait times to spike and rider satisfaction to fall. Transloc very quickly put together a version of its dispatching software that works on Android devices, allowing the taxi service to be used for transporting Flex Service users as well. The agency pays for these rides on a per-trip basis, making it a cost-effective solution.
The state of Kansas has offered the county a $500,000 grant to expand the service to the county’s northern border, allowing riders to connect with the transit options in neighboring Wyandotte County more effectively. As of this writing, the agency has yet to decide whether to take the grant and expand service. The sticking point is that expanding the service area would increase the program’s operating cost to an estimated $1.2 million per year, which, with a pandemic-related budgetary crunch looming, may not be feasible for the county.
Barriers
Historically, the biggest barriers to improving transit service in Johnson County have been low-density development patterns and a lack of support for transit in the community. Both of these are beginning to change: mobile app technology makes flexible service a much more appealing option to potential riders, and several elected officials expressed support for expanding transit options. The county was thus able to benefit from existing partnerships in the region.
Once the service launched, the biggest barrier that Johnson County faced was dealing with the consequences of its own success. Within two weeks of launch, the service was providing 100 rides per day, surpassing the county’s projections and creating more demand than the original three vehicles could meet. Johnson County overcame this barrier by turning to its existing taxi partnership, paying per-ride for taxi trips for riders when county vehicles were unavailable, while also purchasing additional vehicles for use in the Flex Service pilot.
Recently, the COVID-19 pandemic has also posed problems for the Flex Service pilot, as it has for transit providers all over the country. Ridership dropped by 55 percent within a matter of weeks. To create a safer environment for both riders and passengers, the agency began limiting trips to one rider at a time and bought ozone foggers to sanitize the fleet daily. While the county does not require masks on public transit, it does strongly encourage them. To the extent it can, the county has been distributing masks to riders, though a limited supply of masks has made this difficult. The county reports that these precautions have helped Flex Service ridership rebound faster than fixed-route ridership and that, to date, there have been no confirmed cases of the virus among either riders or drivers.
Results
From the perspective of County transportation officials, the service has provided significant mobility benefits by increasing transit ridership among Johnson County residents. Additionally, the service’s success has helped build political support for transit, as the agency can point to the Flex Service’s benefits for both job access and access to social services.
Johnson County has not only seen ridership on its Flex Service exceed expectations, but it has also seen the Flex Service pilot bring new riders to its fixed- route services as well.
Lessons Learned
County officials were pleasantly surprised to discover that the Flex Service was far more popular than they had anticipated. For a time, this led to a reduction in the quality of service they could provide, as they simply could not meet the demand for the service with the vehicles they had available to them. They learned two lessons from this experience: first, that when planning a new service, agencies should be prepared for the service to be more popular than they expect, and second, that taking advantage of existing partnerships, as Johnson County did with Transloc and its local taxi service, is often the most efficient way to address unexpected issues. Using these existing partnerships, as Johnson County did, can help even small communities launch flex service and enhance mobility for their residents.
For more information
For more information about this practice, contact Joshua Powers at Johnson County, Joshua.Powers@jocogov.org.
Government Technology magazine article about Johnson County’s Flex Service and its response to the COVID-19 pandemic: https://www.govtech.com/fs/transportation/Transit-Is-Being-Drawn-to-an-On- Demand-Model-in-Kansas.html
Kansas City Area Transportation Authority: https://www.kcata.org/
Minneapolis Mobility Hubs Pilot
Promising Practice: Strengthening communities by building better connections between modes.
The Minneapolis Mobility Hubs Pilot increases access to convenient, low or no carbon transportation options, including transit, shared scooters, and the Nice Ride bikeshare system, by creating centers where riders can transfer between these modes easily. Implemented in September of 2019, the original pilot covered 12 locations marked by specially designed wayfinding signs in North, Northeast, and South Minneapolis. Mobility hubs include seating, bikeshare docks, transit stops (often on high-frequency routes), and designated parking locations for dockless shared bikes and scooters.
The City of Minneapolis Department of Public Works is expanding the defined use of Mobility Hubs beyond being a place where people can connect to multiple modes of transportation safely and conveniently. In this year’s pilot, the city expanded the number of locations in their Mobility Hub program and is now pivoting hub usage to respond to the new needs of the community due to COVID-19 and civil unrest. The city will be working with local community partners to identify the evolving needs of the low-income neighborhoods disproportionately impacted and use the Hubs as a neighborhood level distribution point.
Context
Minneapolis’ Mobility Hubs were created for two main reasons. One was the desire to address transportation sustainability goals, reducing the carbon footprint of transportation in the region. The other was the desire to improve job access by transit, a major goal of both the region’s MPO as well as large philanthropies in the area. The practice allows easier access to and transfers between a variety of different transportation options, including docked and dockless shared bikes and scooters and bus lines. The pilot was initiated by the City of Minneapolis, which chose to focus on this intervention because the city has a lot more power to change streetscapes and sidewalk furniture than, for instance, change public transit service, which is operated by a regional transit authority. The city believed that this was the best way to use its power over street space to promote mobility.
Mobility Hubs are centers where access to shared mobility modes such as carsharing, bikesharing, ridesharing, and other shared mobility modes are located near public transit stops and centers of population and employment to facilitate transfer activity, access to services, and expand accessibility and mobility for all.
Major stakeholders included the City of Minneapolis, Hennepin County, MnDOT, Metro Transit, NiceRide (the Minneapolis area’s public bikeshare system), shared scooter companies operating in the city (e.g., Lyft, Spin, and Lime), as well as representatives of community organizations in target communities. Targeted communities included neighborhoods of North Minneapolis, Northeast Minneapolis, and South Minneapolis, which were chosen because minorities, low-income households, and individuals without access to a car are disproportionately likely to live in these areas of concentrated poverty in the city. In each community, four specific locations were selected for their proximity to major bus lines and community resources such as groceries, health care centers, libraries, and other social services.
Stakeholder and public engagement were key elements of the practice from the very beginning. Stakeholder engagement began with a day-long regional workshop designed to flesh out a common vision for the roles mobility hubs would play in their communities and some of the features they might offer. For the pilot, project staff then approached the communities in which mobility hubs were planned to discuss specific locations and site plans developed through comprehensive data analysis. This community feedback was integrated into the mobility hub designs. During the initial pilot implementation in Fall 2019, surveys of mobility hub users were conducted both at the hubs themselves and via the internet. Additional feedback was also gathered from community organizations in the target neighborhoods. This feedback, in turn, led to planned improvements for the next round of mobility hub implementations.
State of the Practice and Trends
The Mobility Hub pilot was evaluated in a variety of different ways. The City of Minneapolis looked at ridership on all modes of transportation served by the mobility hubs: buses, shared bikes, and scooters.
The pilot was also evaluated through extensive surveying both at mobility hubs and online. Across all modes, 800,000 trips were made either starting or ending at a Mobility Hub location. Some locations, but not all, saw substantial upticks in shared bike and scooter ridership. This was especially true in locations where existing transit ridership was high, as well as locations away from major arteries where riders felt safer using bikes and scooters.
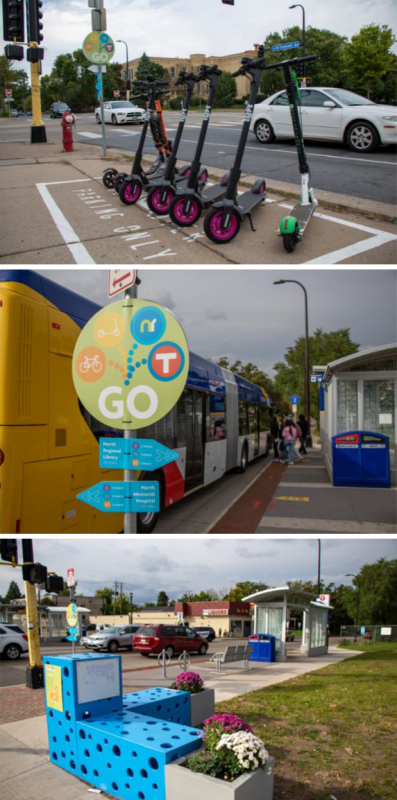
More important to the City’s evaluation of the program were the results of its surveys, particularly the surveys conducted at Mobility Hubs. They found that the most important features of Mobility Hubs to users were that they be places that feel safe, places that provide access to several different transportation options, and also places that people can sit and gather. The street furniture provided at Mobility Hubs was a welcome addition for community members, and members of the community felt that the engagement process clearly took their needs and concerns into consideration. Most importantly, to project staff and city leaders, they found that the Mobility Hubs helped people move around by providing easier access to a variety of low-carbon and no-carbon transportation options.
While the initial pilot was successful, the expansion of the pilot, originally planned for Spring 2020, has been delayed due to external circumstances. The reasons for the delay include pandemic-related funding constraints and delays in getting bikes and scooters onto the streets. Additionally, the series of protests and civil unrest in response to racism in Minneapolis that began in late May 2020 led stakeholders to re-evaluate their plans. The City of Minneapolis saw the unrest as an impetus to return to the drawing board with their site designs and move forward based on the new needs of the neighborhoods.
Minneapolis isn’t the only place in North America in which some form of mobility hub has been tested, with Los Angeles, Boston, Columbus, Ohio, and several Canadian cities among the other places that have piloted this practice.
Resources
Funding for the Mobility Hubs pilot came from philanthropic organizations, with the city’s contribution taking the form of staff time and expertise. Minneapolis was chosen as one of 25 Bloomberg American Climate Challenge cities, with this designation providing the city up to $2.5 million to spend on innovations that would reduce carbon emissions and promote sustainability. Mobility Hubs were specifically mentioned in the city’s application as one of the practices they would be using the grant funding to implement. Other philanthropic organizations, such as the Energy Foundation and the Carbon Neutral Cities Alliance, provided additional support for the engagement work in the initial and expanded pilots.
While the City of Minneapolis did not spend any of its own funds directly on the initial pilot, city staff were involved throughout the process. Staff contributed with time and expertise in designing and implementing the Mobility Hubs (e.g., designing and constructing street furniture and artwork, restriping roads to accommodate bike and scooter parking areas), as well as conducting related stakeholder and public engagement. A total of $170,000 was originally budgeted by the city for implementing the next round of Mobility Hubs, including $100,000 in philanthropic resources and $70,000 in direct city funding. The city was able to secure $25,000 from the NACTO Streets for Pandemic Response and Recovery Grant program to cover budget shortfalls for the city portion. Some new Mobility Hub locations were also included in the city’s 20 in 20 intersection safety improvement program to include additional pedestrian safety interventions such as curb extensions.
Barriers
Danielle Elkins, a strategic consultant who coordinated the Mobility Hub pilot for the City of Minneapolis, cited logistical hurdles as the most significant barrier they had to overcome in implementing the Mobility Hub pilot. Streetscape interventions, even temporary ones, required the city to go through time-consuming processes with multiple internal stakeholder departments to get county or state permission for various aspects of the project to move forward. Having all of the political leaders and agency heads in agreement, at least in broad strokes, about the path forward for Mobility Hubs made these processes easier to navigate. As Ms. Elkins is a contractor, not a city employee, she suggested that it may have been easier for her to navigate these logistical issues than it may have otherwise been for a municipal employee with a variety of other daily duties.
Many smaller and rural communities are home to successful shared mobility programs, such as bicycle libraries, publically-operated carsharing programs, and designated park- and-ride locations that facilitate carpooling and vanpooling. Rural communities can seek to integrate these systems with public transportation through physical mobility hubs and/or through integration in trip planning or fare payment systems.
Lessons Learned
One lesson pointed to by Ms. Elkins was the need to start the process earlier, because of both the need for extensive outreach and the need to navigate internal processes with a number of stakeholders. (The planning and design phase for this project took about 15 months.) As a result, the initial 12 pilot locations were not rolled out until September of 2019. Because of the city’s harsh winters, shared bikes and scooters are usually not made available in winter in Minneapolis. To help drive traffic to the Mobility Hubs, their season was extended, but they were still taken off the streets for the winter shortly after the region’s first major snowstorm. The city is still navigating how to provide multiple mobility options at these hubs during the winter months, but they did learn that snow clearance would be an important part of maintenance for these hubs.
Another lesson for the city was the importance of its extensive engagement process. Going to the target communities, listening to residents’ concerns, and changing the Mobility Hubs as a result of that engagement, helped members of these underserved communities feel like this wasn’t just another city project, but something that was intended to help meet their mobility needs.
At the time of this writing, the City of Minneapolis is trying to integrate into its Mobility Hub plan some of the lessons the city learned during the recent uprising in the community. It is trying to make sure that its Mobility Hubs provide essential services for residents of underserved neighborhoods, even as the unrest has temporarily or permanently forced those services to relocate.
For more information
Contact Danielle Elkins at the City of Minneapolis: danielle.elkins@minneapolismn.gov.
The City of Minneapolis’ 2019 report on its Mobility Hubs Pilot can be found at http://www2.minneapolismn.gov/www/groups/public/@publicworks/documents/webcontent/wcmsp- 224822.pdf
The Shared Use Mobility Center’s writeup of the Mobility Hub pilot can be found at https://sharedusemobilitycenter.org/mobility-hubs-in-twin-cities/?gclid=EAIaIQobChMIhr- MwtL16QIVFACGCh3JjAleEAAYASAAEgKcDvD_BwE